

Three Steps to Unlock Growth with Data Analytics: A Guide for Small Businesses
- Jane Moore

- Aug 16, 2024
- 2 min read
In today’s competitive market, businesses of all sizes are harnessing the power of data analytics to drive success. For small businesses, using data effectively can be a game-changer, providing insights that lead to smarter decisions and accelerated growth. While the benefits of data analytics are clear, small businesses often face challenges in implementing these analyses on their own.
To start using data analytics to grow your business, listed below are three simple steps that will help you uncover new insights and keep your business moving forward. We'll also discuss how teaming up with a data analytics company can be crucial for gaining a deeper understanding of your data.
1. Collect Data
The first step in leveraging data analytics is to start collecting data. But don't worry, this process doesn’t need to be overwhelming. Begin by gathering data from various touchpoints within your business. This could include sales records, customer interactions, website traffic, and social media engagement. Tools like customer relationship management (CRM) systems, Google Analytics, and basic spreadsheets (excel, google sheets, etc.) can simplify data collection.
For instance, using a CRM system can automatically track customer interactions and purchase history, while Google Analytics provides insights into website performance. The key is to ensure that you’re consistently collecting relevant data that can be used to identify patterns and trends.
2. Visualize Data
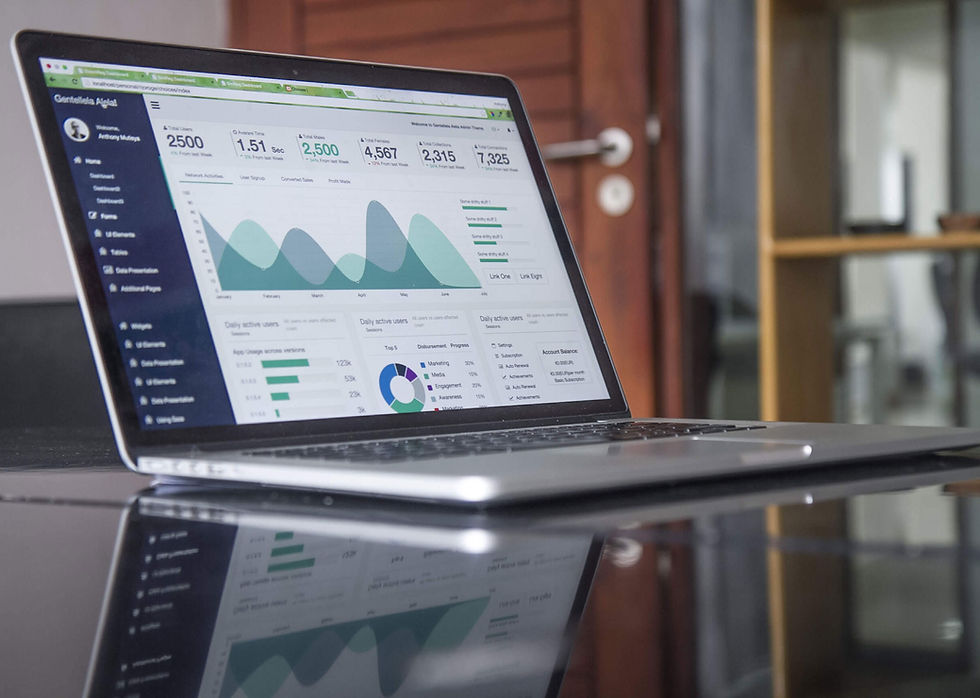
Once you have collected data, the next step is to visualize it. Data visualization helps you see patterns and trends that might not be immediately obvious from raw numbers. By creating charts, graphs, and dashboards, you can gain a clearer perspective on your business’s performance.
Simple visualizations might include bar charts showing sales over time, pie charts representing customer demographics, or line graphs tracking website traffic trends. Tools like Microsoft Excel, and Google Data Studio offer user-friendly options for creating visual representations of your data. These visual insights make it easier to understand your business’s performance and identify areas for improvement.
3. Set Objectives and Goals
With data collection and visualization in place, it’s important to use this information to set objectives and goals for your business. Analyze the patterns and trends revealed through your data to establish a baseline for your performance. From this baseline, you can set specific, measurable goals that align with your business objectives.
For example, if your data shows a decline in customer retention rates, you might set a goal to improve customer satisfaction by implementing a new loyalty program. Regularly review your data to track progress toward these goals and adjust your strategies as needed.
Implementing these simple data analytics steps can significantly benefit your small business by providing basic insights and guiding decisions. However, to fully unlock the potential of your data and achieve deeper analysis, your business may want to invest in extra help. Our team at Matz Analytics will ensure that your business is not only collecting and visualizing data effectively, but also leveraging it to make informed, strategic decisions that propel your success. Allow us to improve your efforts with professional data analytics support and optimize your business’s success.
Click here to get started with us today!


Comments